
These are the basic steps to find and process satellite imagery. Please first make sure you are registered and are familiar with the Agriobs Interface.
0. Make sure the Online / Offline Toggle is set to Online.
1. Center the map over your area of interest (AOI). This might be a place you have field boundaries setup or elsewhere. The map AOI sets the search area, not the field boundaries.
2. In the Toolbox, the very first Tool is Search. Make sure it is set to 30 Days and press Search.
3. The Search Results area will begin to populate with satellite imagery captured over the last 30 days within the screen area.
4. Inspect the dates (4a), satellite imagery source (4b), and cloud cover (4c) for each available item.
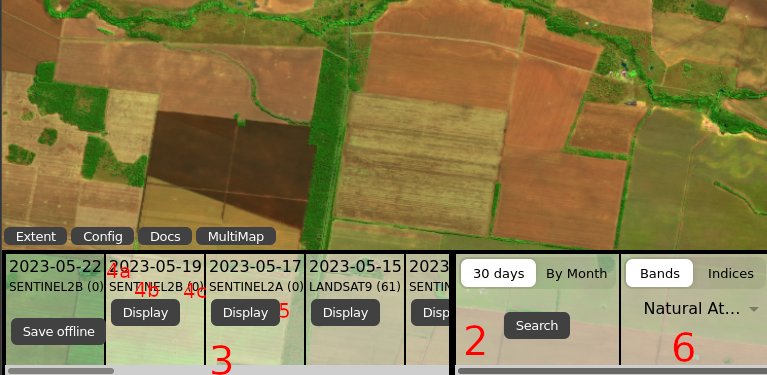
5. By default the most recent imagery with less than 5% cloud cover will be selected. If you want to select a different item, then just press Display.
6. By default the imagery will be processed as Natural Atmospheric Removal band combination. You can change the band combination to True Color for a more visually accurate but less acute option.
Natural Atmospheric Removal band combination includes Shortwave, Near Infrared and Green bands inserted into the Blue-Green-Red color space. This provides an acute visual ideal for examining agricultural regions.
7. You can zoom in and pan the map around as desired. Just remember if you go too far away from your initial AOI search you will need to search again to get relevant results in your search box.
8. To process imagery to vegetation index like NDVI, change the Bands / Indices toggle to Indicies. By default the vegetation index MCARI2 will be selected. You can press the selection arrow to show a list of the indices available in the shortlist.
MCARI2 is a vegetation index similar to NDVI, but does not saturate to the same extent. Therefore, at high biomass variability is more pronounced.
8. Once you select an Index you will see another tool available in the Toolbox called a Range Slider. This tool allows you to set the minimum and maximum values at which the color scale begins and ends. Adjusting the range slider will affect all imagery the same.
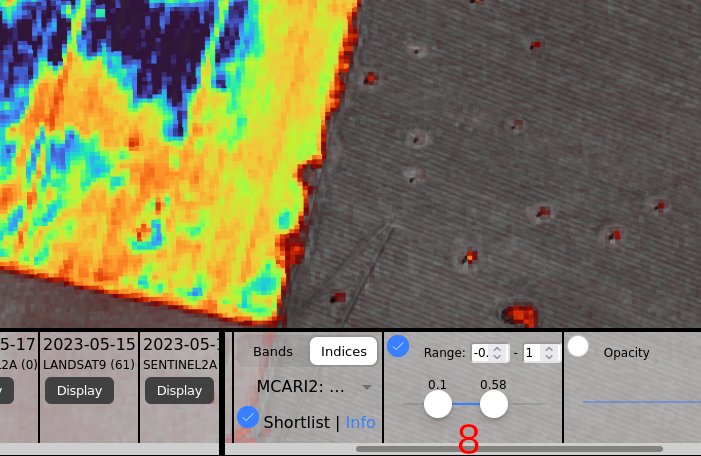
9. Press the circle checkbox to enable the Range Slider. The two number boxes allow you to set the minimum and maximum that the slider will move to. These are usually set on sensible values already. Now press and drag one of the circle sliders and see what happens. You can now adjust the color scale to suit any situation.
10. To visualise emerging crops with MCARI2 you may require a range of 0.02 to 0.1. For a high biomass crop consider 0.6 to 0.9.
The index visualisation uses thresholding. Any value below what is set on the Range Slider will go transparent, allowing the high resolution base layer to be seen.